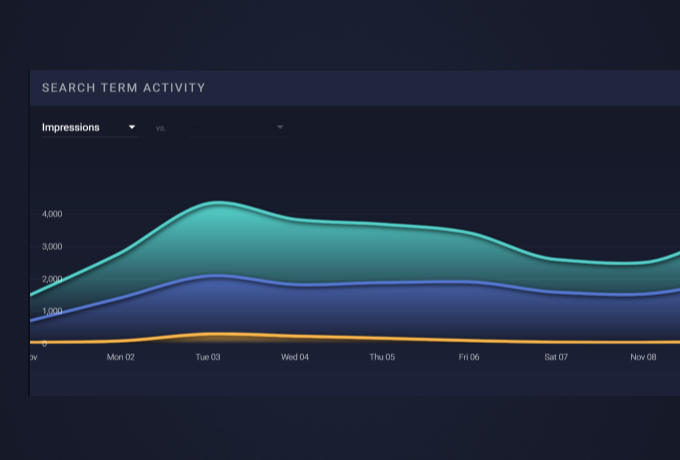
AiTrk4 for Ai Media Group
Ai Media Group is an ad buying agency based in NYC. I was hired as a front-end developer to assist in developing the latest iteration of their proprietary web application, AiTrk4.
Date: July 2018 - June 2021
Tech I Worked With: JavaScript, D3, Dojo Toolkit
Responsibilities: Front-End Development
Type: Web App
App Architecture
Overview
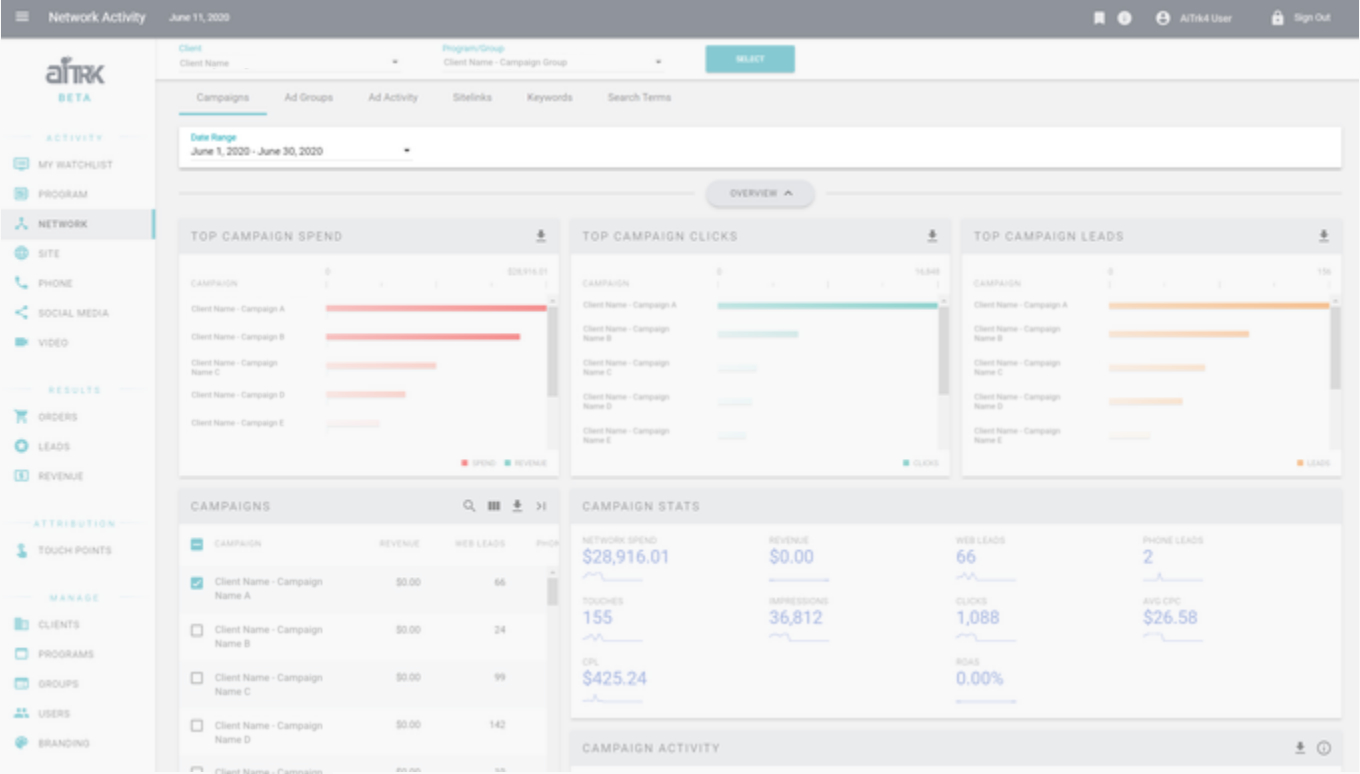
AiTrk4 is composed of a predictable pattern: Section > Tab > (several) Cards. This pattern/hierarchy is possible because of the architecture of the app. As a side effect, everything is also very modular and components can be swapped out.
While I did not do any of the original architecting, understanding it was crucial when making changes as a few elements of the tech stack are no longer in common use.
Basic Data Flow
Most of the data flow is kicked off by a click of the Submit button. Including that action, the data flow process involves...
- The user selects a client, program/group, and date range
- A card requests data
- The Ai server hands it over
- The Card transforms the raw data for its needs
- The data is displayed using a visualization or table
There were often situations in which the transformed data needed to be examined and debugged. The specific technical hazards I needed to solve for are outlined in the Technical section.
The Pub/Sub System
The asynchronous data flow in AiTrk4 is heavily reliant on the “pub/sub system”.
The pub/sub system is centered around “topics”, which themselves are simple text strings. Topics are “subscribed to” (via a JS method) and “published to” (also via a JS method). Using a “subscribe” method on a topic is like adding an event listener for some custom event, and using a “publish” method is like firing off the event.
In the case of AiTrk4, most of these custom events essentially boiled down to “the data requested is ready (for topic X)”. A card is subscribed to a topic depending on the endpoint it uses in the JS code. If any card uses the same endpoint, they’ll have the same topic. So, whichever card loads first will request the data, but all cards that require that data will end up receiving it once it arrives.
Using the pub/sub system was much easier than trying to wrestle with pre-set events, and more efficient than using actual custom events (because custom events will inform every node in the system, thereby causing a lot of overhead).
User Scenario
A user wants to view data for the Google campaign for client “Innovation Corp.”
- The user uses the Client Picker to select “Innovation Corp.” first, and then selects the Program “Google Display”.
- The user confirms their selection (data request is sent) and waits for the data to load.
- The user views the dashboard and now also has the option to select a more specific date range (and a separate data request is sent).
So what happens each time a data request is sent?
Asynchronous Data Flow
① Cards Send Data Requests
Once a user confirms their Client+Program/Group selection, the cards send their request to the server using an endpoint. Remember, each card manages its own data and sends off its own request, and the application needed to be able to handle any request in any order given (hence the ‘asynchronous’ part).
Hazards: It was imperative that topics were spellchecked and made sure to be the same if they required the same endpoint. Failing to do so would cause the app to load the same data multiple times.
② Endpoint Receives Data
The endpoint gets the raw server data and then assembles it into JSON that the frontend can use.
Hazards: Occasionally, we would have cases where the data that appeared on the front-end wasn’t as expected or showed incorrect results. In these cases, debugging was required at each step of the data transform to see where these errors occurred. (Was it a server problem? Was data transformed incorrectly on the front-end?)
③ Cards Receive Data
When the data is ready to load, any card that will use that data (has the same “topic”) gets published to and given said data.
④ Cards Copy the Data
Cards copy the data from the server
Hazards: Cards using the same topic also shared the same data by reference. The problem with that is each card/viz tended to have slightly different schemas (both between each other as well as the data straight from the server), so the data needed to be transformed. If the data wasn’t copied over to a card-specific variable (and allowed to be edited “by value”) before being transformed, data bugs would turn up because “Card A” was manipulating “Card B”’s data accidentally.
Debugging this required checking the data of all the cards using the same topic and then seeing if one of them (likely the first that received the data) was affecting the others.
⑤ Cards Transform the Raw Data
Cards transform the raw data.
Hazards: Due to the raw server data not always having the same schema, you usually could not do a copy-paste of the data transform between different cards. Each transform needed to be tailored to the card, and then tailored to the viz the card would use.
⑥ Transformed Data is Sent to Visualizations
The transformed data is sent to and used by the visualizations
Data Transformations
Common Steps
- Create categories data can be sorted into
- Run through the initial data and add/tabulate based on categories
- Send the resulting categories object to the viz
Following are some examples of what kinds of categories data got sorted into for step (1).
Date-based Categorization (Date Binning)
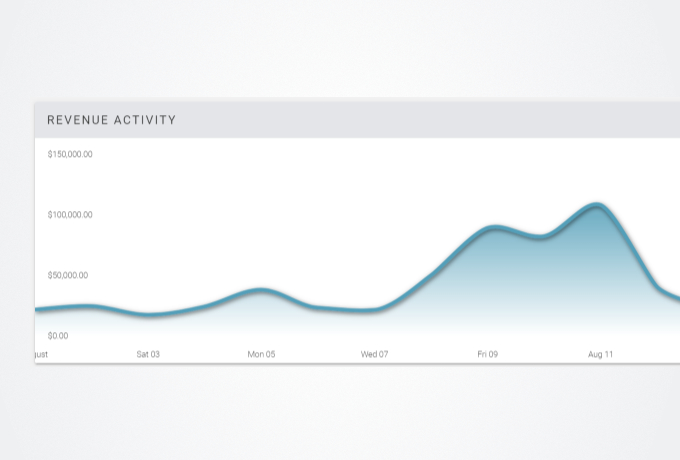
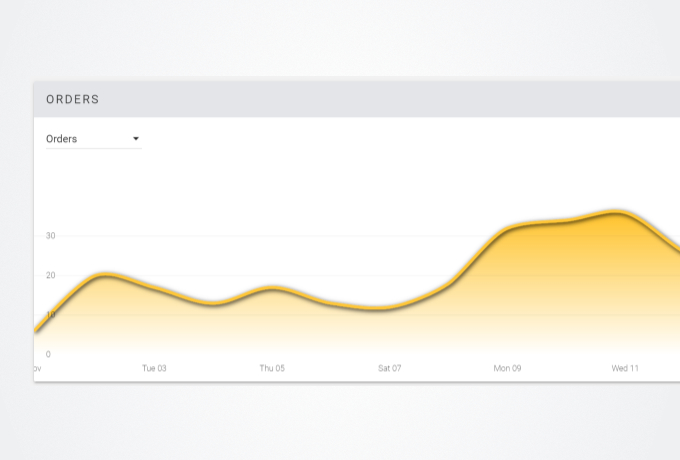
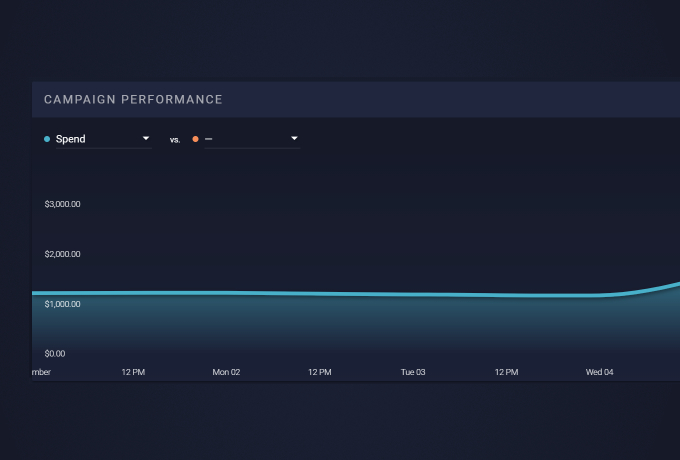
Linearea chart and sparkline data needed to be transformed via a process we called “date binning”. In this process, an object was created that contained named objects for every date in the date range.
Why? Charts needed all dates in the schema, even if the metric had a value of 0. This is because the lines would otherwise be drawn in a way that someone might think there actually was a non-0 value for that particular date.
Pre-Determined Categories
For cards like the donut charts, the categories were set in code instead of dynamically (ie according to date range) since there were usually a set of expected categories (and they had designated color sets to go with them too).
Cards
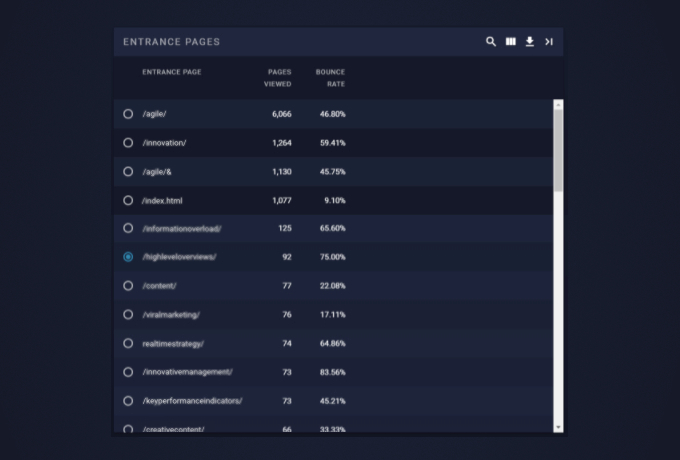
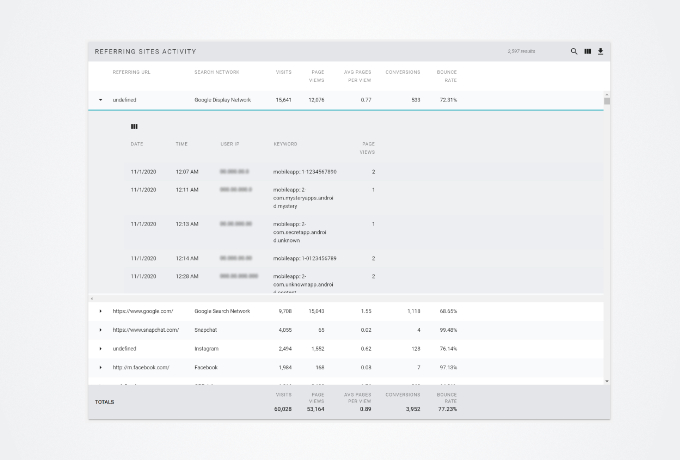
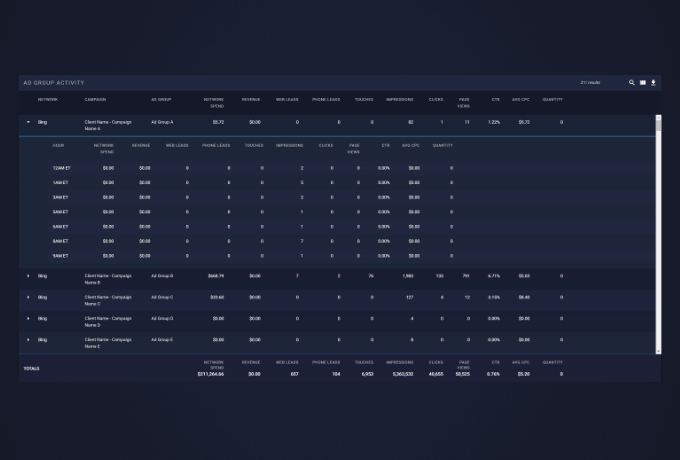
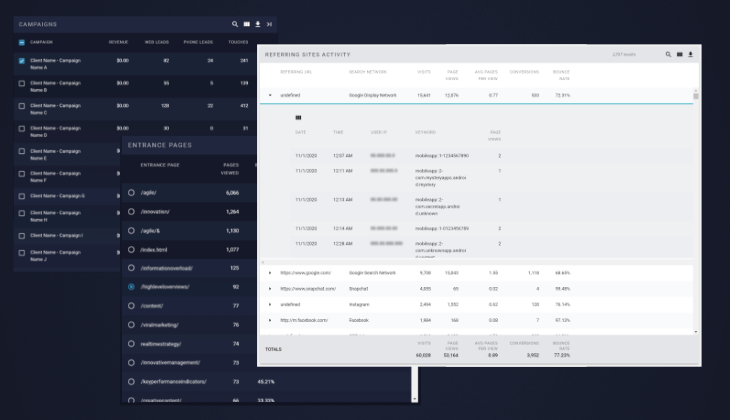
The main content components of AiTrk4. Cards were used to contain various visualizations, tables of data, and any other information in the app.
Much of the data flow debugging itself took place at the card level, and I was responsible for a lot of card development from the initial version (pre-card-specific data) to the final versions that didn't require senior developer intervention. Specific hazards and details about the cards are outlined in the Technical section.
Card Components
Card ASPX
The card ASPX itself handles the main structure (column width and such), card viz legends, the empty state, the info button content, preloader viz, card title, and of course, it points to the JS that the card ends up using.
Card JS
The JS of the cards used on the pages all extend a main Card prototype, so they all share some commonalities (and are able to use the same menu buttons/mixins without difficulty). Furthermore, the JS is generally of similar structure, most cards have common methods (constructor, setup, onload, update) with predictable flow between these methods.
Hazard: Occasionally, depending on the card, the method flow would be different and thus the data flow would become unpredictable. When detangling this, I typically plopped in some console logs with easily identifiable messages to see what order they fired in.
Card JS - AMD
The Card JS is where most of the variable components of the card was declared. The reason for this was the Asynchronous Module Definition system - various pieces reused between cards were all AMD modules and got included in the JS. Even parts that had places in the ASPX (such as the info button) needed their AMD modules included to fully work.
So, how did these modules look like and work in practice?
AMD Examples - Tabular Cards
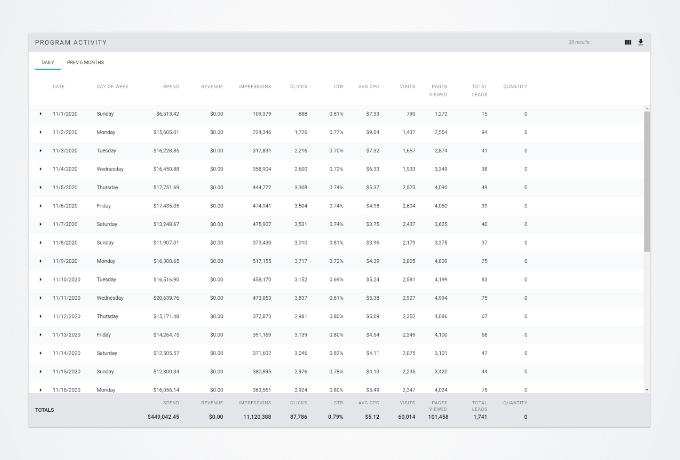
This section contains a few examples of different "Table Cards". The tables are all using the same base dGrid, but may also include an AMD module that modifies its behavior and/or appearance.
In addition, the cards containing the tables are using different modules that usually change the table's appearance, or use the data the table is using. The front-end elements for these modules can usually be found on the right side of the card's title section.
AMD Examples - Chart Cards
This section contains a few examples of different "Linearea Chart" Cards. The tables are all using the same base dGrid, but may also include an AMD module that modifies its behavior and/or appearance.
Detail (Parent and Child) Cards
User Scenario
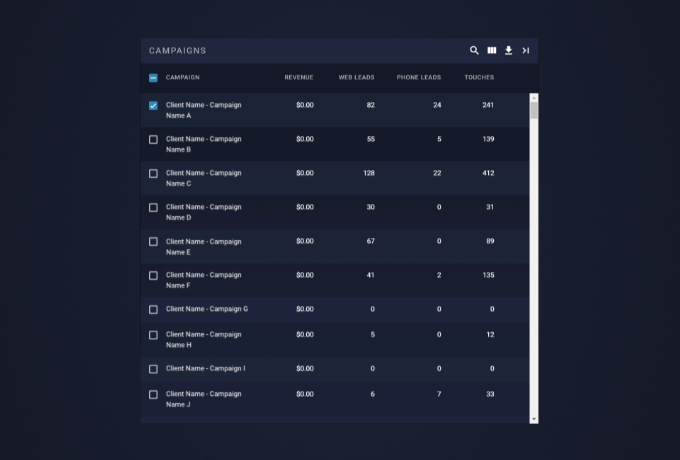
The user selects or deselects data in the parent card to view in more detail in the child cards.
Technical Bits
Basic set-up for the Detail Cards was similar to the main cards, in that...
- It used the pub/sub system (see the previous Technical section for more details) to pass data around
- That data got copied and then transformed
- transformed data got sent to the visualizations
However, the exact use of the pub/sub system was a bit different.
- All cards in a "detail set" have a shared topic defined. The child cards subscribe to this topic, and the parent card will use the topic to publish the info to.
- When the user Selects and Deselects items, an event fires on each selection/deselection. This event also calls the publish method, and sends the data selected in the parent card (the “filtered data”) to the topic shared between the child and parent cards.
- The filtered data gets processed according to the kind of information the child card is displaying.
Hazards: Same as the initial pub/sub data loading, each card needs to make its own copy of data before modifying things so that they don’t end up stepping on each other’s toes.
Specific Features I Worked On
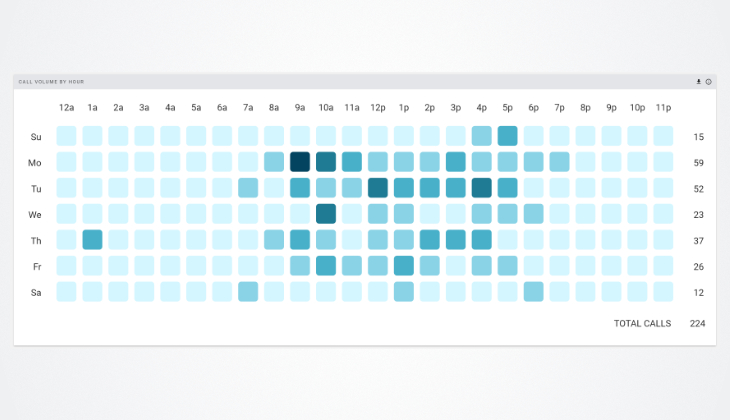
Heatmap
This visualization was originally requested so that people could see, at a glance, the most popular days and times for when a client got phone calls. The a few of the visual requirements were as follows:
- Display equally sized squares at even intervals in a given space (including responsively).
- Make square color based upon a dynamic color scale that updates depending on the data set given (so more calls = darker square).
- Display a tooltip with the total number of calls per square upon square hover.
I adjusted an existing heatmap visualization to meet the above design requirements and also work as a reusable AMD module.
Detail Table Expander
All of the parent/child card sets had table cards on the left side. Some of these have a large amount of data, so it was requested that they be able to be expandable so the user may be able to look at more information when making detail selections.
To achieve this, I needed to make my own AMD module and ensure any changes as a result of the card expansion didn't interrupt the user experience.
Sidebar Expander
At some point during development, it was requested that the sidebar be able to be collapsed and allow the user to view more information at once. Completing this request required going into Material Design Lite's code and overwriting default behavior.
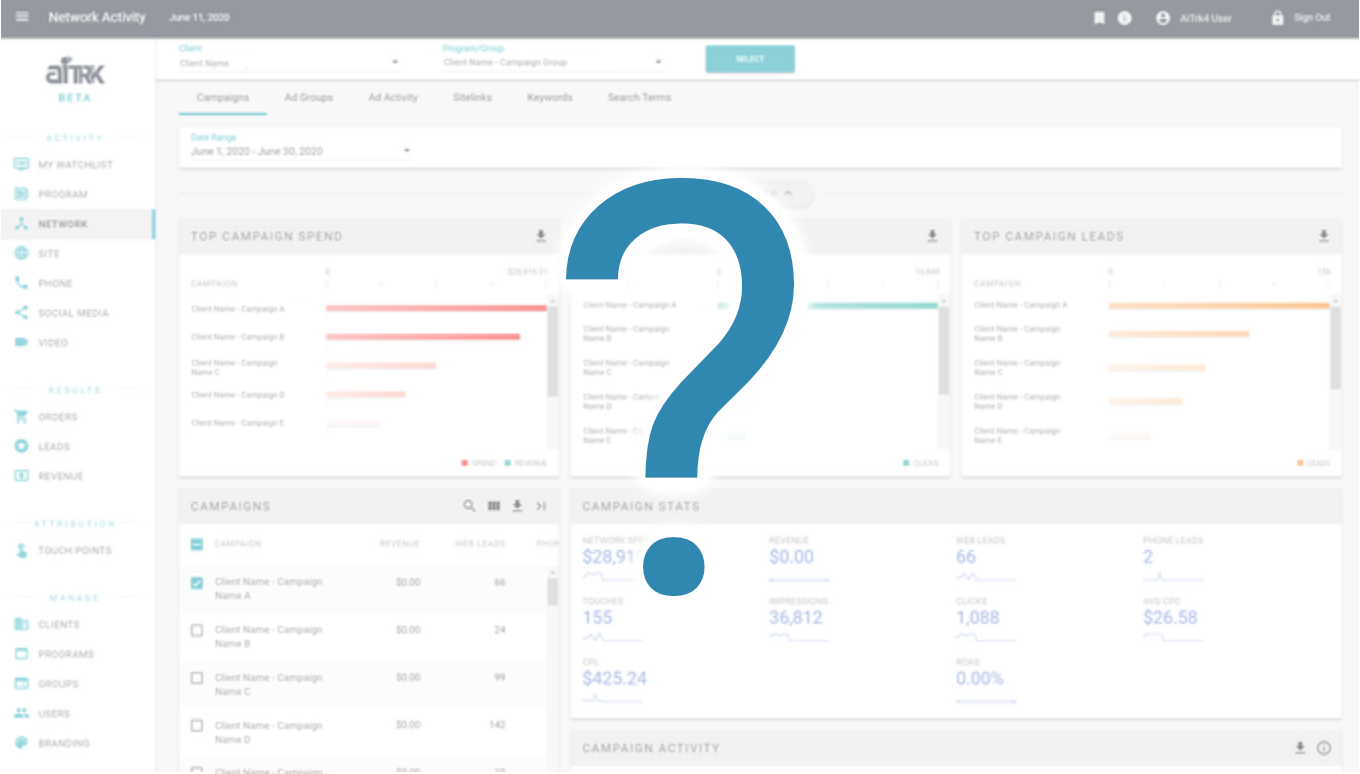
Documentation and Training
If you haven’t guessed from this case study, I actually do enjoy writing detailed (and clear, I hope) documentation. Most of it was written with the assumption that a brand new developer to the project could look at it and understand it. So, I tried to use minimal jargon and overly technical terms where possible.
Additionally, I was involved with developing training sessions when AiTrk4 was being taken out of beta. These were conducted remotely and designed to be understood by all units of the company.
Example Documentation
Card Tracing - Document for new developer onboarding; it showed exactly how to find files associated with a card by locating specific pieces of code as well as noting naming conventions that were stuck to across the app. Associated files usually included the file for the section, the file for the section tab, the endpoint(s) used by the card, any standard procedures (sprocs) used, and the topic used for the XHR data flow.
Card Directory - This was a quick reference for developers who wanted to find files associated with a card, but hadn’t yet internalized the content in the Card Tracing document. This was also a quick reference for the DBAs, who could just use this document to figure out which sprocs to edit instead of needing to document it per-ticket or ask a developer.
New Developer Onboarding Document - I contributed to this document as I was onboarding. Specifically, I assisted in filling out the sections having to do with setting up the VPN and AiTrk4’s dev environment (on both Mac and PC). A section having to do with transferring virtual machines was also added by me, as I needed to transfer a Parallels VM on Mac to VirtualBox on PC at one point.
How to change the endpoints - Guide for developer onboarding and DBAs. It showed what to be wary of when editing endpoint files as well as how to find the meat of what needed to be edited (the SQL) for someone who was unfamiliar with C#. (Before, most of the endpoint SQL was on the endpoint file itself. Eventually this changed, and the SQL was instead referred to by a standard procedure that the DBAs edited.)
How to test the endpoints - Guide for developer onboarding. Essentially described how to create an endpoint link to check raw data from, as well as documented the query strings used by the endpoint.
